Determines the power or the non-centrality parameter for the generic F-Test with (optional) Type 1 and Type 2 error plots.
Usage
power.f.test(
  power = NULL,
  ncp = NULL,
  null.ncp = 0,
  df1,
  df2,
  alpha = 0.05,
  plot = TRUE,
  verbose = 1,
  utf = FALSE
)
Arguments
- power
statistical power \((1 - \beta)\); either
powerorncpneeds to be NULL (and is then estimated).- ncp
non-centrality parameter for the alternative; either
powerorncpneeds to be NULL (and is then estimated).- null.ncp
non-centrality parameter for the null.
- df1
integer; numerator degrees of freedom.
- df2
integer; denominator degrees of freedom.
- alpha
type 1 error rate, defined as the probability of incorrectly rejecting a true null hypothesis, denoted as \(\alpha\).
- plot
logical;
FALSEswitches off Type 1 and Type 2 error plot.TRUEby default.- verbose
1by default (returns test, hypotheses, and results), if2a more detailed output is given (plus key parameters and definitions), if0no output is printed on the console.- utf
logical; whether the output should show Unicode characters (if encoding allows for it).
FALSEby default.
Value
- power
statistical power \((1-\beta)\).
- ncp
non-centrality parameter under alternative.
- null.ncp
non-centrality parameter under null.
- df1
numerator degrees of freedom.
- df2
denominator degrees of freedom.
- f.alpha
critical value(s).
Examples
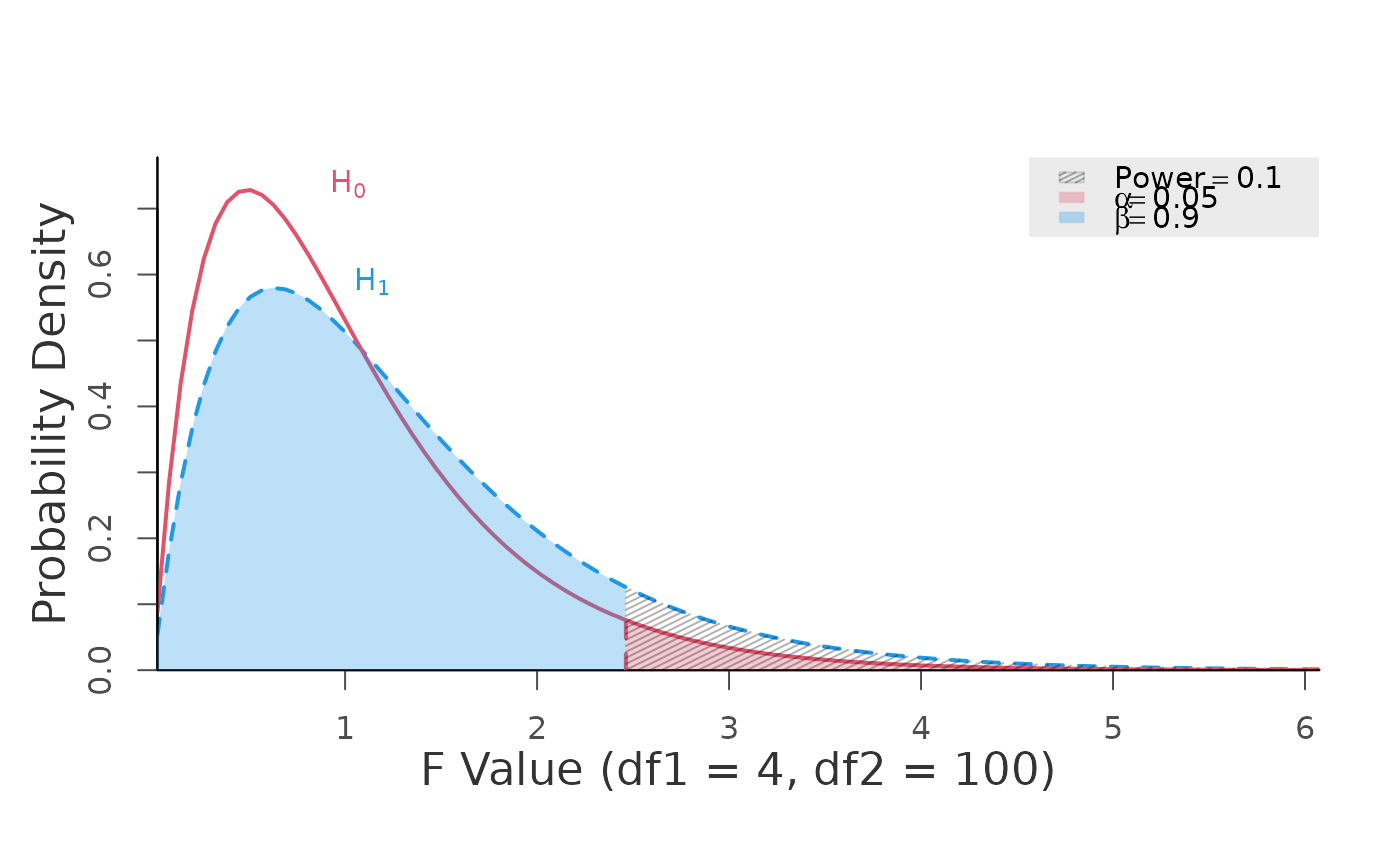
# power is defined as the probability of observing a test statistics greater
# than the critical value
power.f.test(ncp = 1, df1 = 4, df2 = 100, alpha = 0.05)
 #> +--------------------------------------------------+
#> | POWER CALCULATION |
#> +--------------------------------------------------+
#>
#> Generic F-Test
#>
#> ----------------------------------------------------
#> Hypotheses
#> ----------------------------------------------------
#> H0 (Null) : lambda = 0
#> H1 (Alternative) : lambda > 0
#>
#> ----------------------------------------------------
#> Results
#> ----------------------------------------------------
#> Target NCP (lambda) = 1 (vs. null.lambda = 0)
#> Presumed Sample S. = 105
#> Type 1 Error (alpha) = 0.050
#> Type 2 Error (beta) = 0.897
#> Statistical Power = 0.103 <<
#>
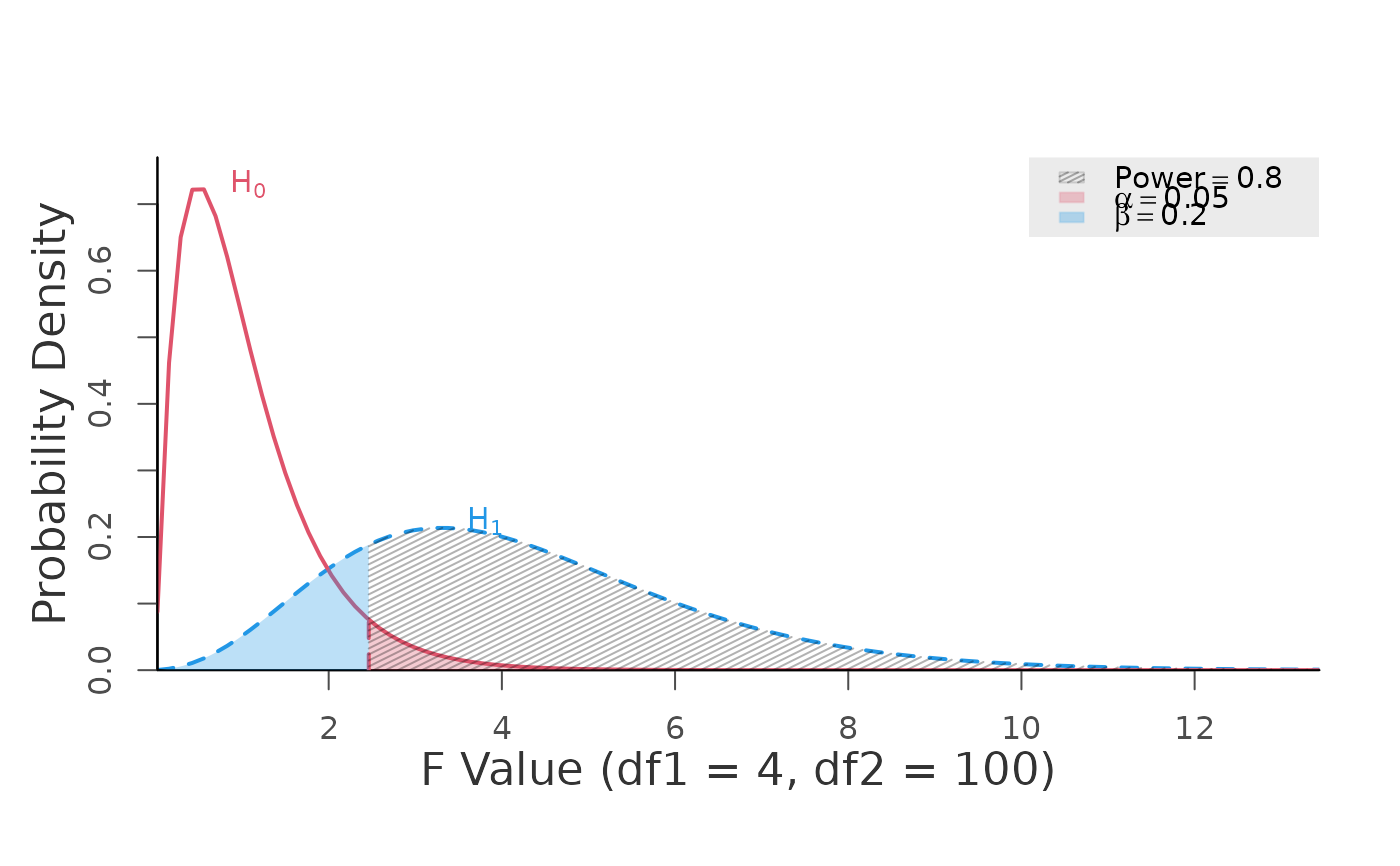
power.f.test(power = 0.80, df1 = 4, df2 = 100, alpha = 0.05)
#> +--------------------------------------------------+
#> | POWER CALCULATION |
#> +--------------------------------------------------+
#>
#> Generic F-Test
#>
#> ----------------------------------------------------
#> Hypotheses
#> ----------------------------------------------------
#> H0 (Null) : lambda = 0
#> H1 (Alternative) : lambda > 0
#>
#> ----------------------------------------------------
#> Results
#> ----------------------------------------------------
#> Target NCP (lambda) = 1 (vs. null.lambda = 0)
#> Presumed Sample S. = 105
#> Type 1 Error (alpha) = 0.050
#> Type 2 Error (beta) = 0.897
#> Statistical Power = 0.103 <<
#>
power.f.test(power = 0.80, df1 = 4, df2 = 100, alpha = 0.05)
 #> +--------------------------------------------------+
#> | MINIMUM DETECTABLE NCP CALCULATION |
#> +--------------------------------------------------+
#>
#> Generic F-Test
#>
#> ----------------------------------------------------
#> Hypotheses
#> ----------------------------------------------------
#> H0 (Null) : lambda = 0
#> H1 (Alternative) : lambda > 0
#>
#> ----------------------------------------------------
#> Results
#> ----------------------------------------------------
#> Target NCP (lambda) = 12.514 (vs. null.lambda = 0) <<
#> Presumed Sample S. = 105
#> Type 1 Error (alpha) = 0.050
#> Type 2 Error (beta) = 0.200
#> Statistical Power = 0.800
#>
#> +--------------------------------------------------+
#> | MINIMUM DETECTABLE NCP CALCULATION |
#> +--------------------------------------------------+
#>
#> Generic F-Test
#>
#> ----------------------------------------------------
#> Hypotheses
#> ----------------------------------------------------
#> H0 (Null) : lambda = 0
#> H1 (Alternative) : lambda > 0
#>
#> ----------------------------------------------------
#> Results
#> ----------------------------------------------------
#> Target NCP (lambda) = 12.514 (vs. null.lambda = 0) <<
#> Presumed Sample S. = 105
#> Type 1 Error (alpha) = 0.050
#> Type 2 Error (beta) = 0.200
#> Statistical Power = 0.800
#>